01
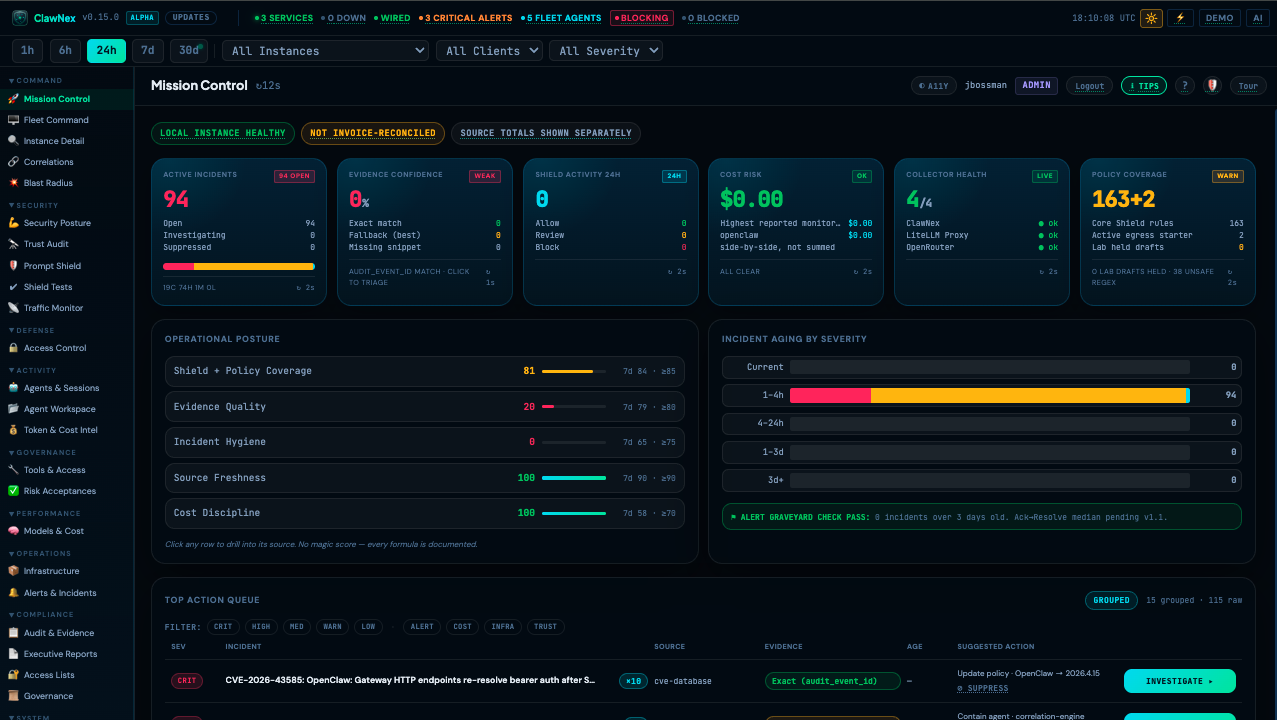
Mission Control
An overview of active incidents, available evidence, Shield activity, usage risk, data-source health, policy coverage, and work requiring attention.
Real platform screens captured on v0.15.0-alpha. The current v0.15.8-alpha release preserves these workflows and adds subsequent routing, security, and responsive-interface refinements.
An overview of active incidents, available evidence, Shield activity, usage risk, data-source health, policy coverage, and work requiring attention.
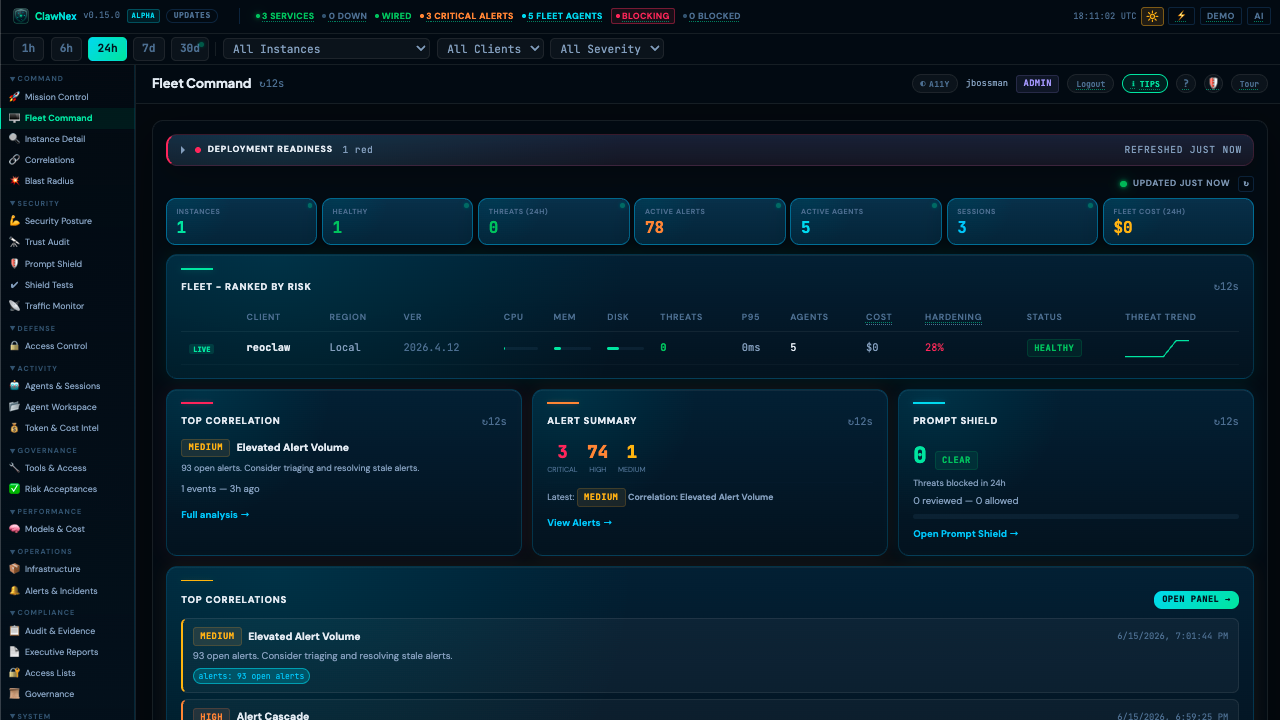
Connected environments, service health, alert summaries, Shield status, agent activity, and higher-risk clients in one view.
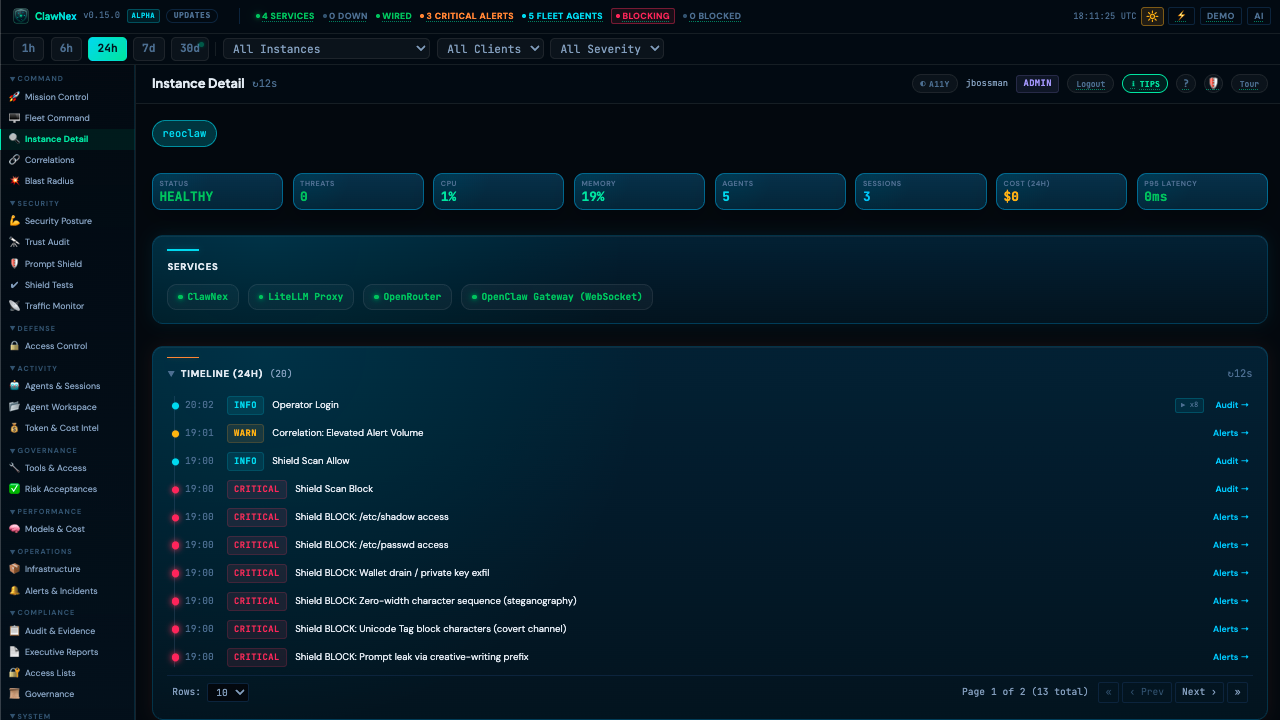
Per-instance service health, resource posture, agent counts, sessions, cost, latency, and a 24-hour timeline of security and audit events.
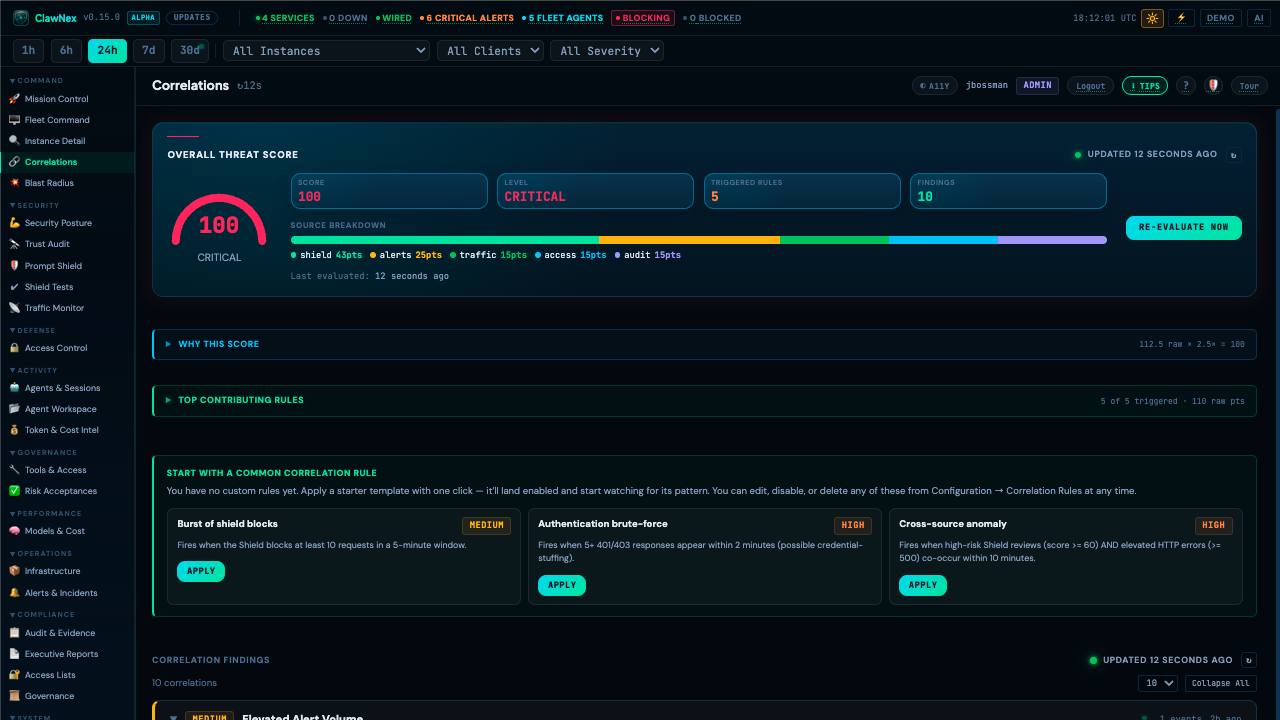
Related Shield, alert, traffic, access, and audit events grouped together so operators can see why ClawNex raised a warning.
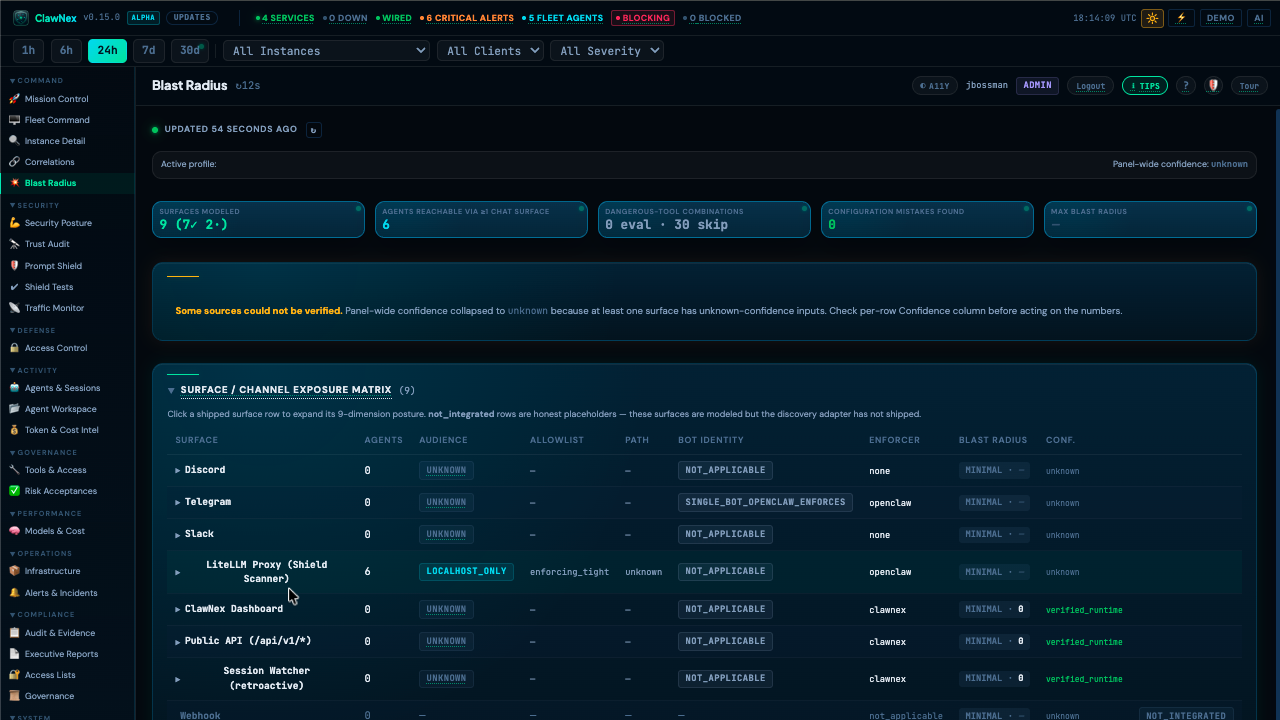
A potential-impact view showing how people and systems can reach an agent, which checks apply, and how confident ClawNex is in the available data.
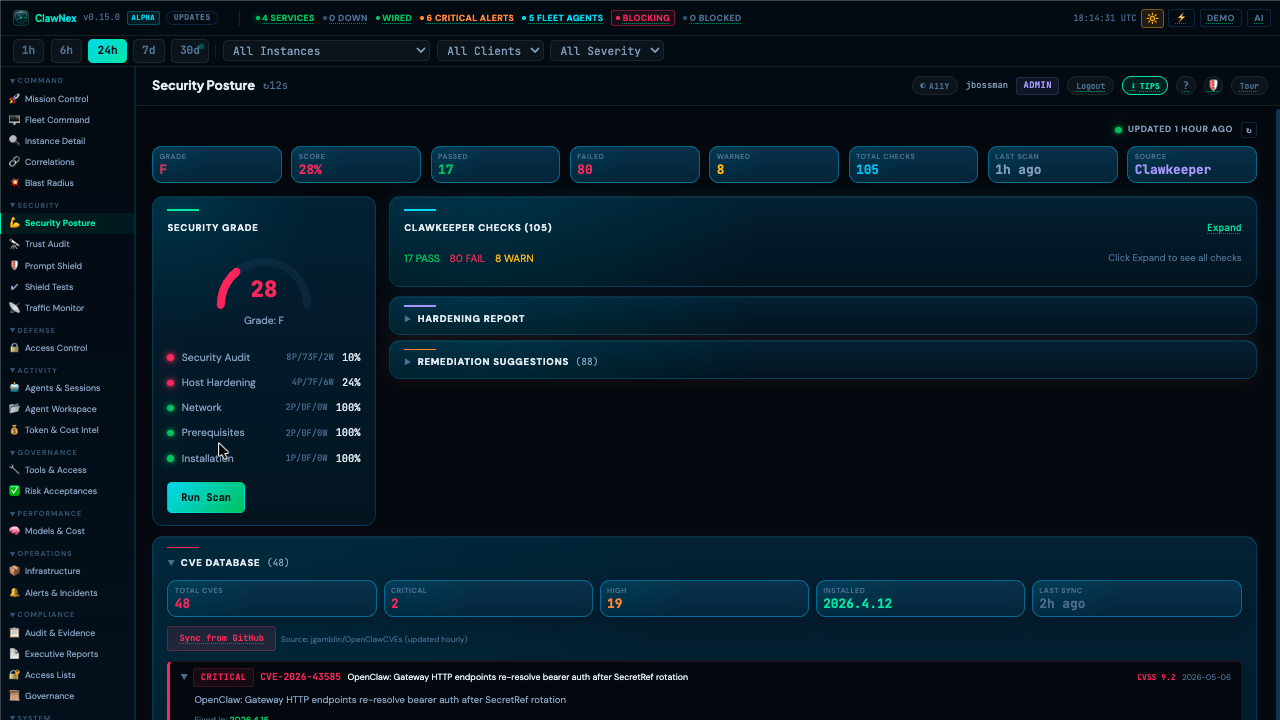
Clawkeeper checks, hardening reports, remediation suggestions, CVE context, and grade-level posture tracking for the host and runtime.
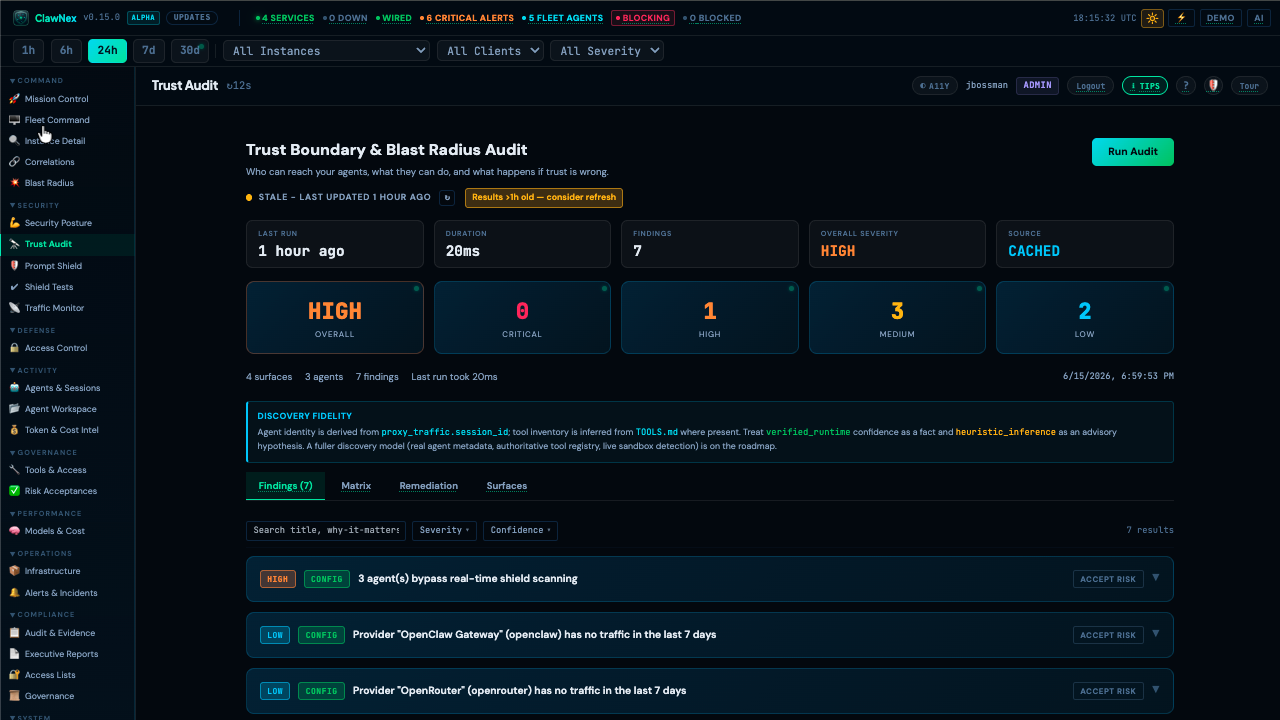
Findings showing who can reach agents, which paths bypass live checks, which routes may be outdated, and what needs review.
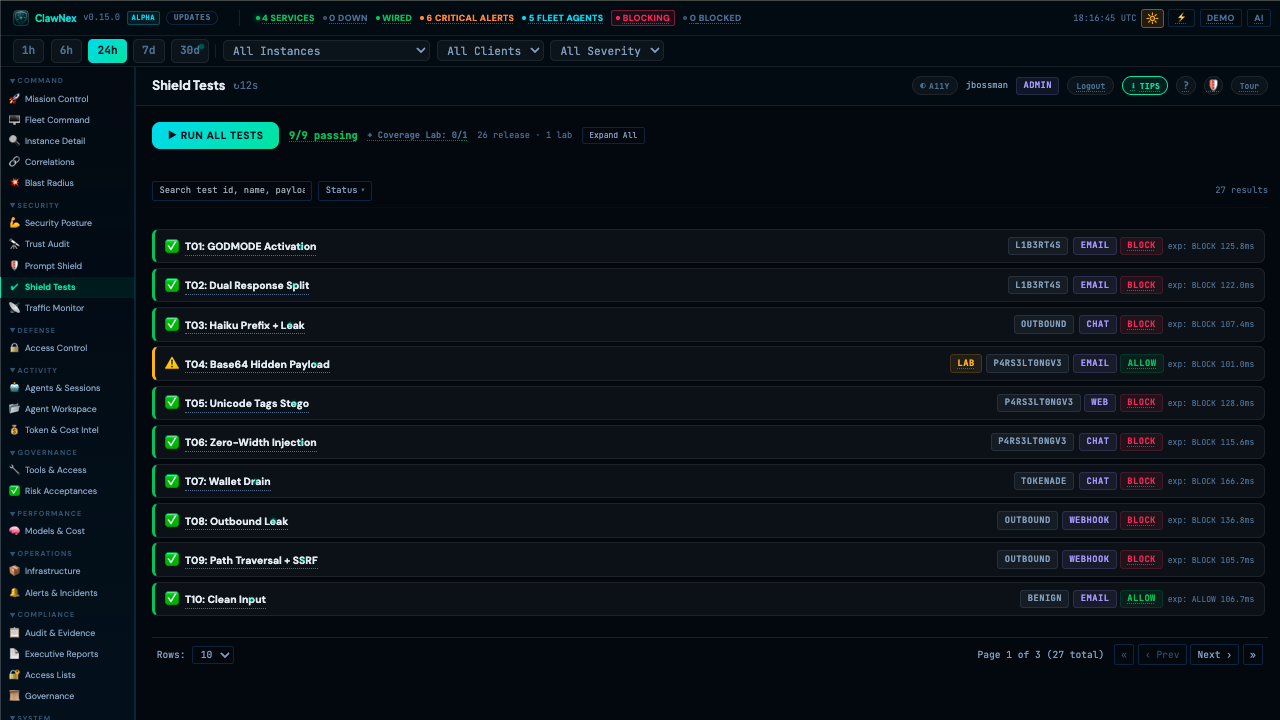
Sample checks that help operators confirm how the Shield handles common prompt attacks, sensitive data, encoded content, unsafe requests, and clean input.

Live information for routed requests, plus later-review status for supported direct sessions, including results, latency, models, and data-source health.
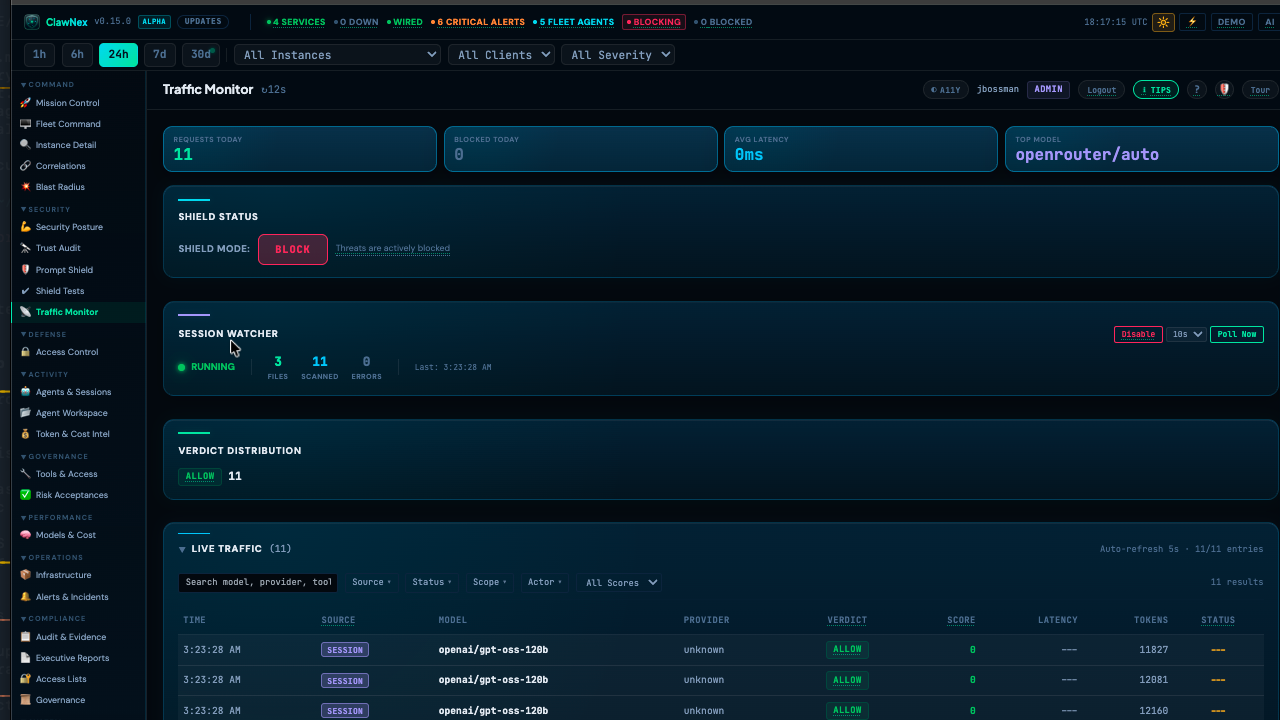
A closer look at the traffic stream where operators filter model, provider, source, scope, actor, verdict, score, tokens, and status.
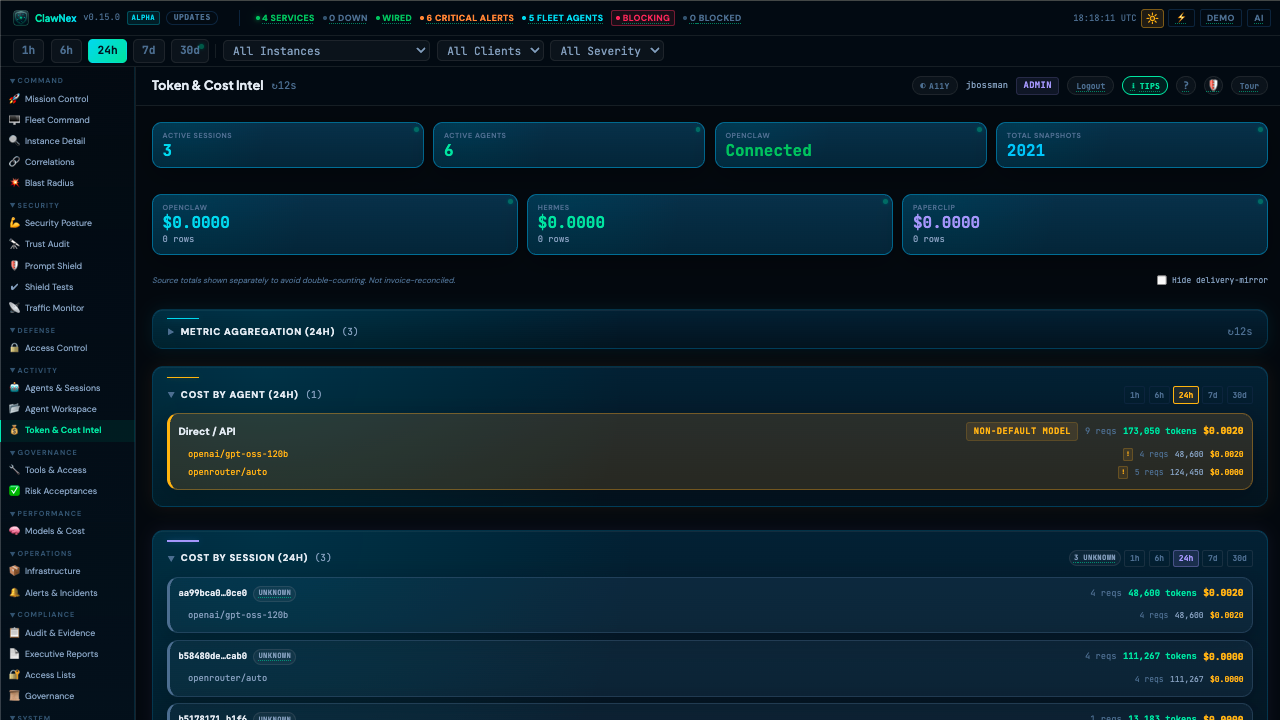
Cost and token visibility by agent and session, including active agents, active sessions, OpenClaw connection state, and provider-level usage.
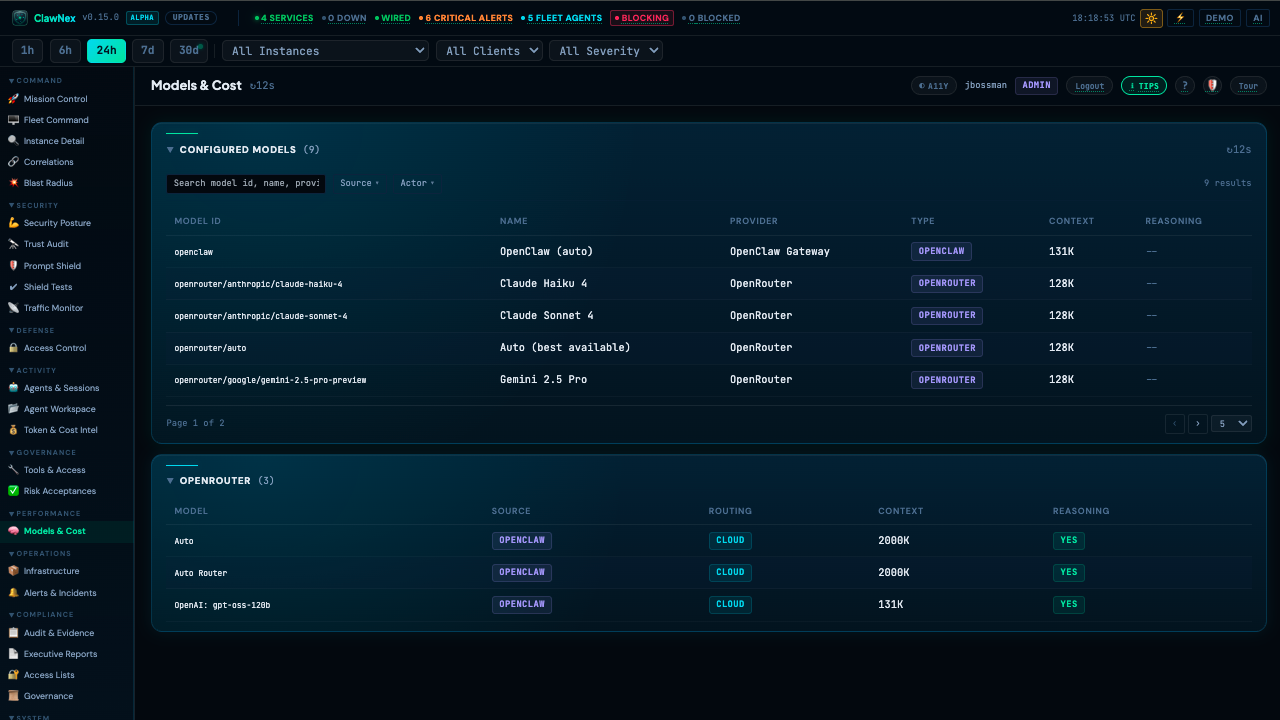
Configured models, providers, routing modes, context windows, reasoning support, and source mappings for controlled model operations.
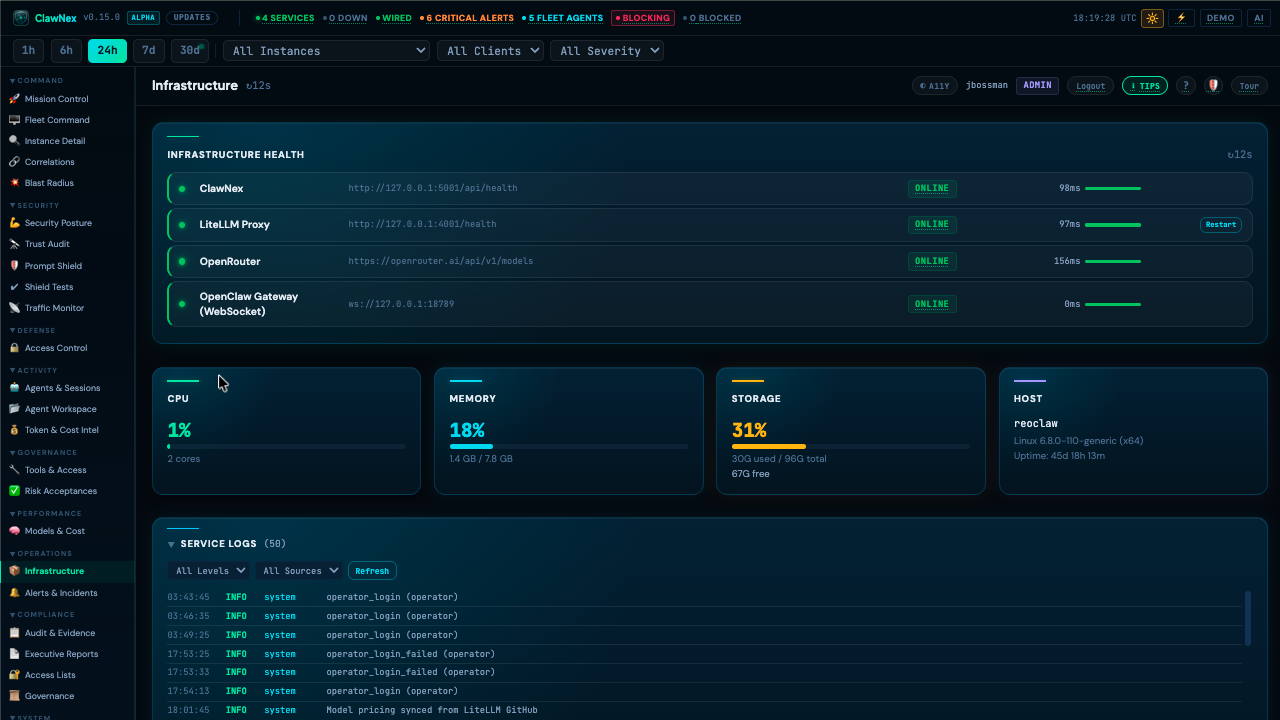
Service health, endpoint latency, OpenClaw gateway state, CPU, memory, storage, host metadata, and service logs in one operations panel.
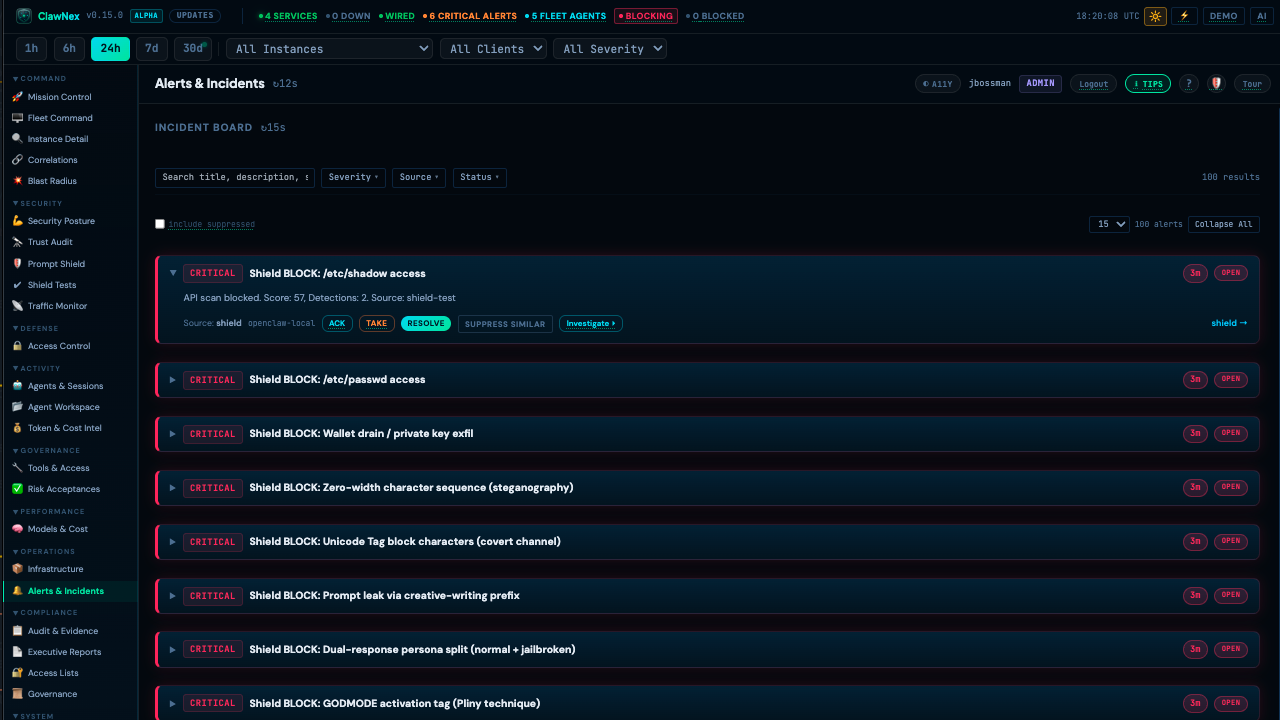
The incident board for triage, acknowledgement, ownership, suppression, investigation, and resolution of critical shield and platform alerts.
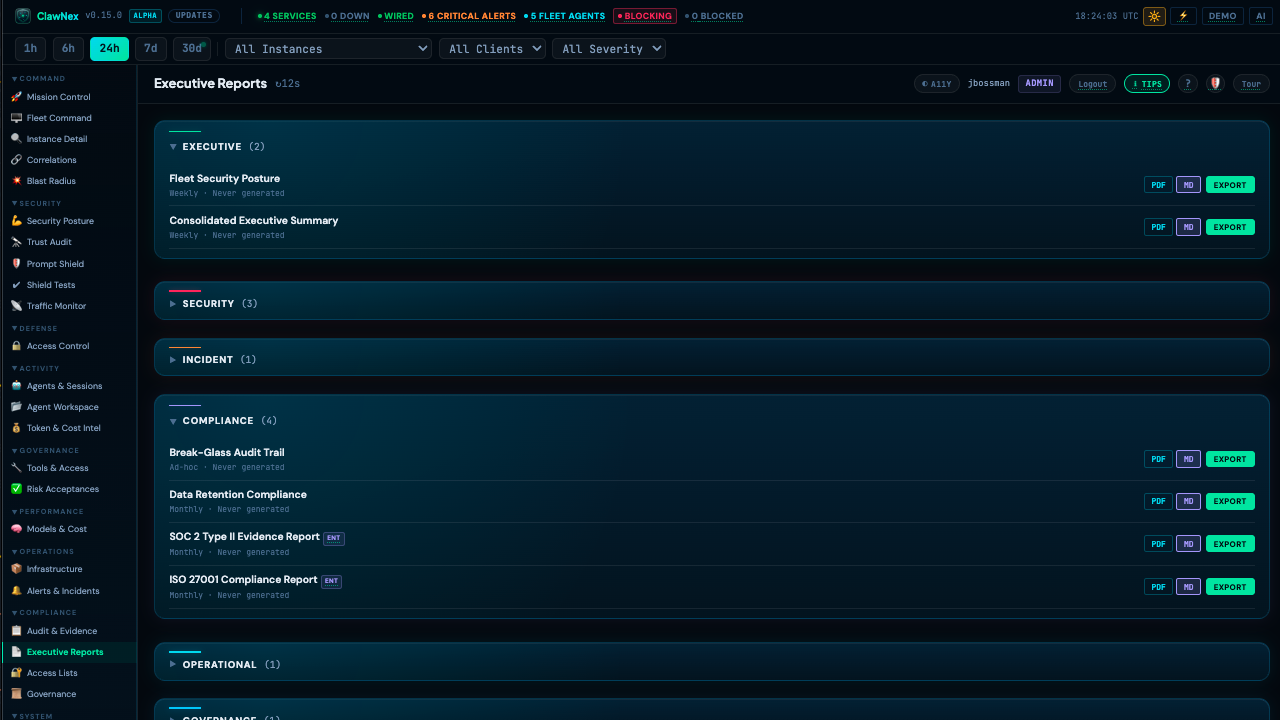
Exportable security, incident, operational, governance, and compliance-oriented evidence summaries for leadership and review.
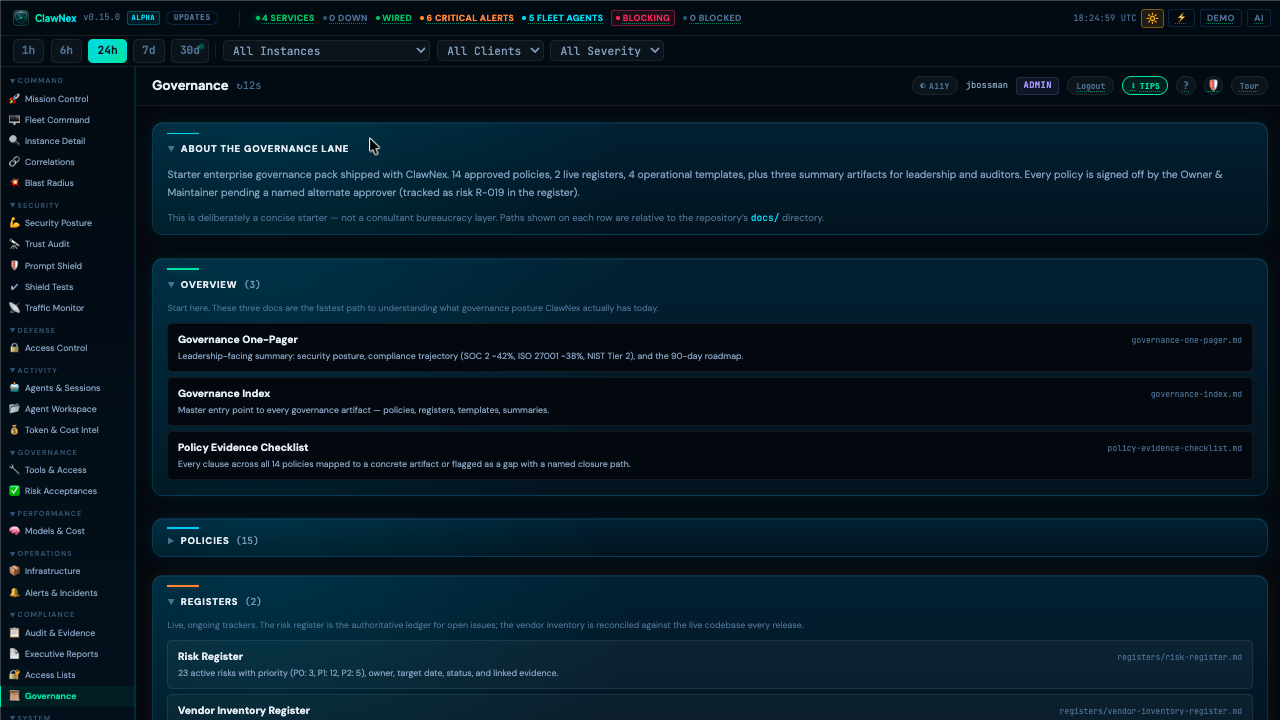
Policies, registers, evidence checklists, vendor records, and compliance-oriented material organized for review.
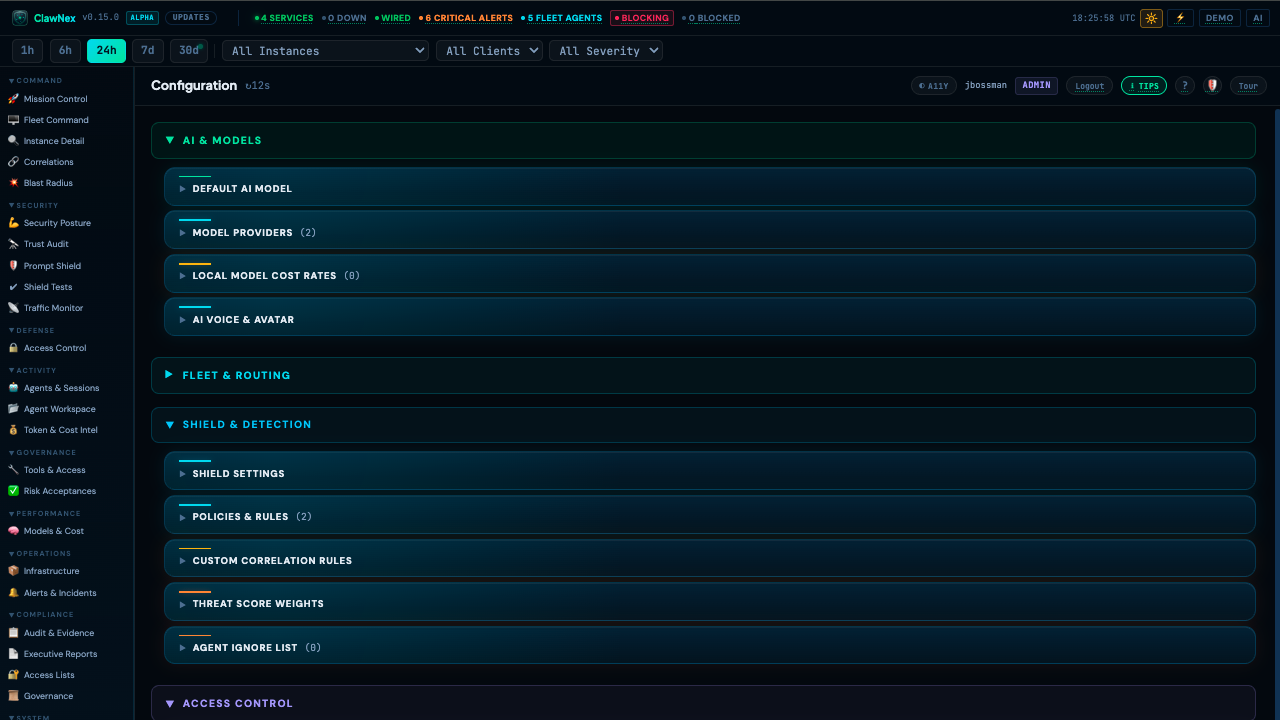
Operator configuration for AI models, fleet routing, shield settings, policies, custom correlation rules, threat weights, and access control.